Texas Almanac, 1945-1946 Page: 200
[610] p. : ill. ; 23 cm.View a full description of this book.
Extracted Text
The following text was automatically extracted from the image on this page using optical character recognition software:
Oklahoma in 1910, is the
leading dwarf variety.
Average acreage in Texas
for the period 1932-41 was
29,000, average production
4,200 tons and yield 296
pounds an acre. All of
Texas' 1943 crop of 2,700 tons
was sold off the farm. Pro-
duction jumped to 8,500 tons
in 1944, valued at $1,998,000.
Data below on broomcorn
acreage, production and
value are from the U. S. De-
partment of Agriculture:
Harv'd Prod'n Farm
Yr - Acres. (Tons). Value.
1920 ... 33,000 3,800 $448,000
1921 ....25,000 3,900 293,000
1922 ....16,000 3,000 600,000
1923 ... 51,000 9,300 1,396,000
1924 ....23,000 4,800 480,000
1925 ....12,000 1,800 252,000
1926 ....16,000 3,100 233,000
1927 ....11,000 1,300 143,000
1928 ....12,000 1,400 150,000
1929 ....10,000 1,500 168,000
1930 ....10,000 1,400 105,000
1931 ....10,000 1,500 60,000
1932 .... 9,000 1,300 46,000
1933 .... 8,000 1,200 126,000
1934 ....16,000 2,900 450,000
1935 ....75,000 12,000 900,000
1936 ....38,000 5,200 525,000
1937 ... .34,000 4,600 294,000
1938 ....29,000 4,400 246,000
1939 ... 21,000 2,200 216,000
1940 ... 29,000 4,600 253,000
1941 ... 23,000 4,200 525,000
1942 ... 21.000 3,300 472,000
1943 ... 18,000 2,700 702,000
1944 .. 46,000 8,500 1,998,000
SOYBEANS
In spite of the phenomenal
expansion of the soybean in
the Corn Belt where it is
now a major industry, the
crop has never gained head-
way in Texas because no
reliable variety has been de-
veloped. There are hundreds
of varieties and tests are be-
ing made by experiment sta-
tions for the various parts
of the state with the hope of
TEXAS ALMANAC.-1945-1946.
filling the shortage in vege-
table oils caused by the re-
duction of cotton acreage.
Texas oil mills crushed more
than 9,000,000 bushels of
northern-grown soybeans in
the 1943-44 season. The soy-
bean is now a leading com-
petitor for cottonseed, both
as an oil and protein feed
for livestock. Average acre-
ae of soybeans from 1932 to
1941 was 2,000, but In 1943
the acreage jumped to 25,000
with a production of 188,000
bushels, yielding 7.5 bushels
an acre. Texas' production
of 188,000 bushels was dis-
posed of as follows. 118,000
sold, 66,000 fed to livestock
and the remainder used for
seed. The crop brought $1.86
a bushel, making the value
of sales $219,000 Production
in Texas to date has cen-
tered primarily in Northeast
Texas. The crop has been
found useful in chemurgic
industries through conver-
sion into plastics.
SWEET SORGHUM AND
SUGAR CANE
Sweet sorghums, grown
primarily in the eastern part
of Texas, are used for a for-
age crop and in making sor-
ghum syrup. Sugar cane is
grown on coastal prairies
and in Southeast Texas and
produces from 700,000 to
1,000,000 gallons of sugar-
cane syrup annually.
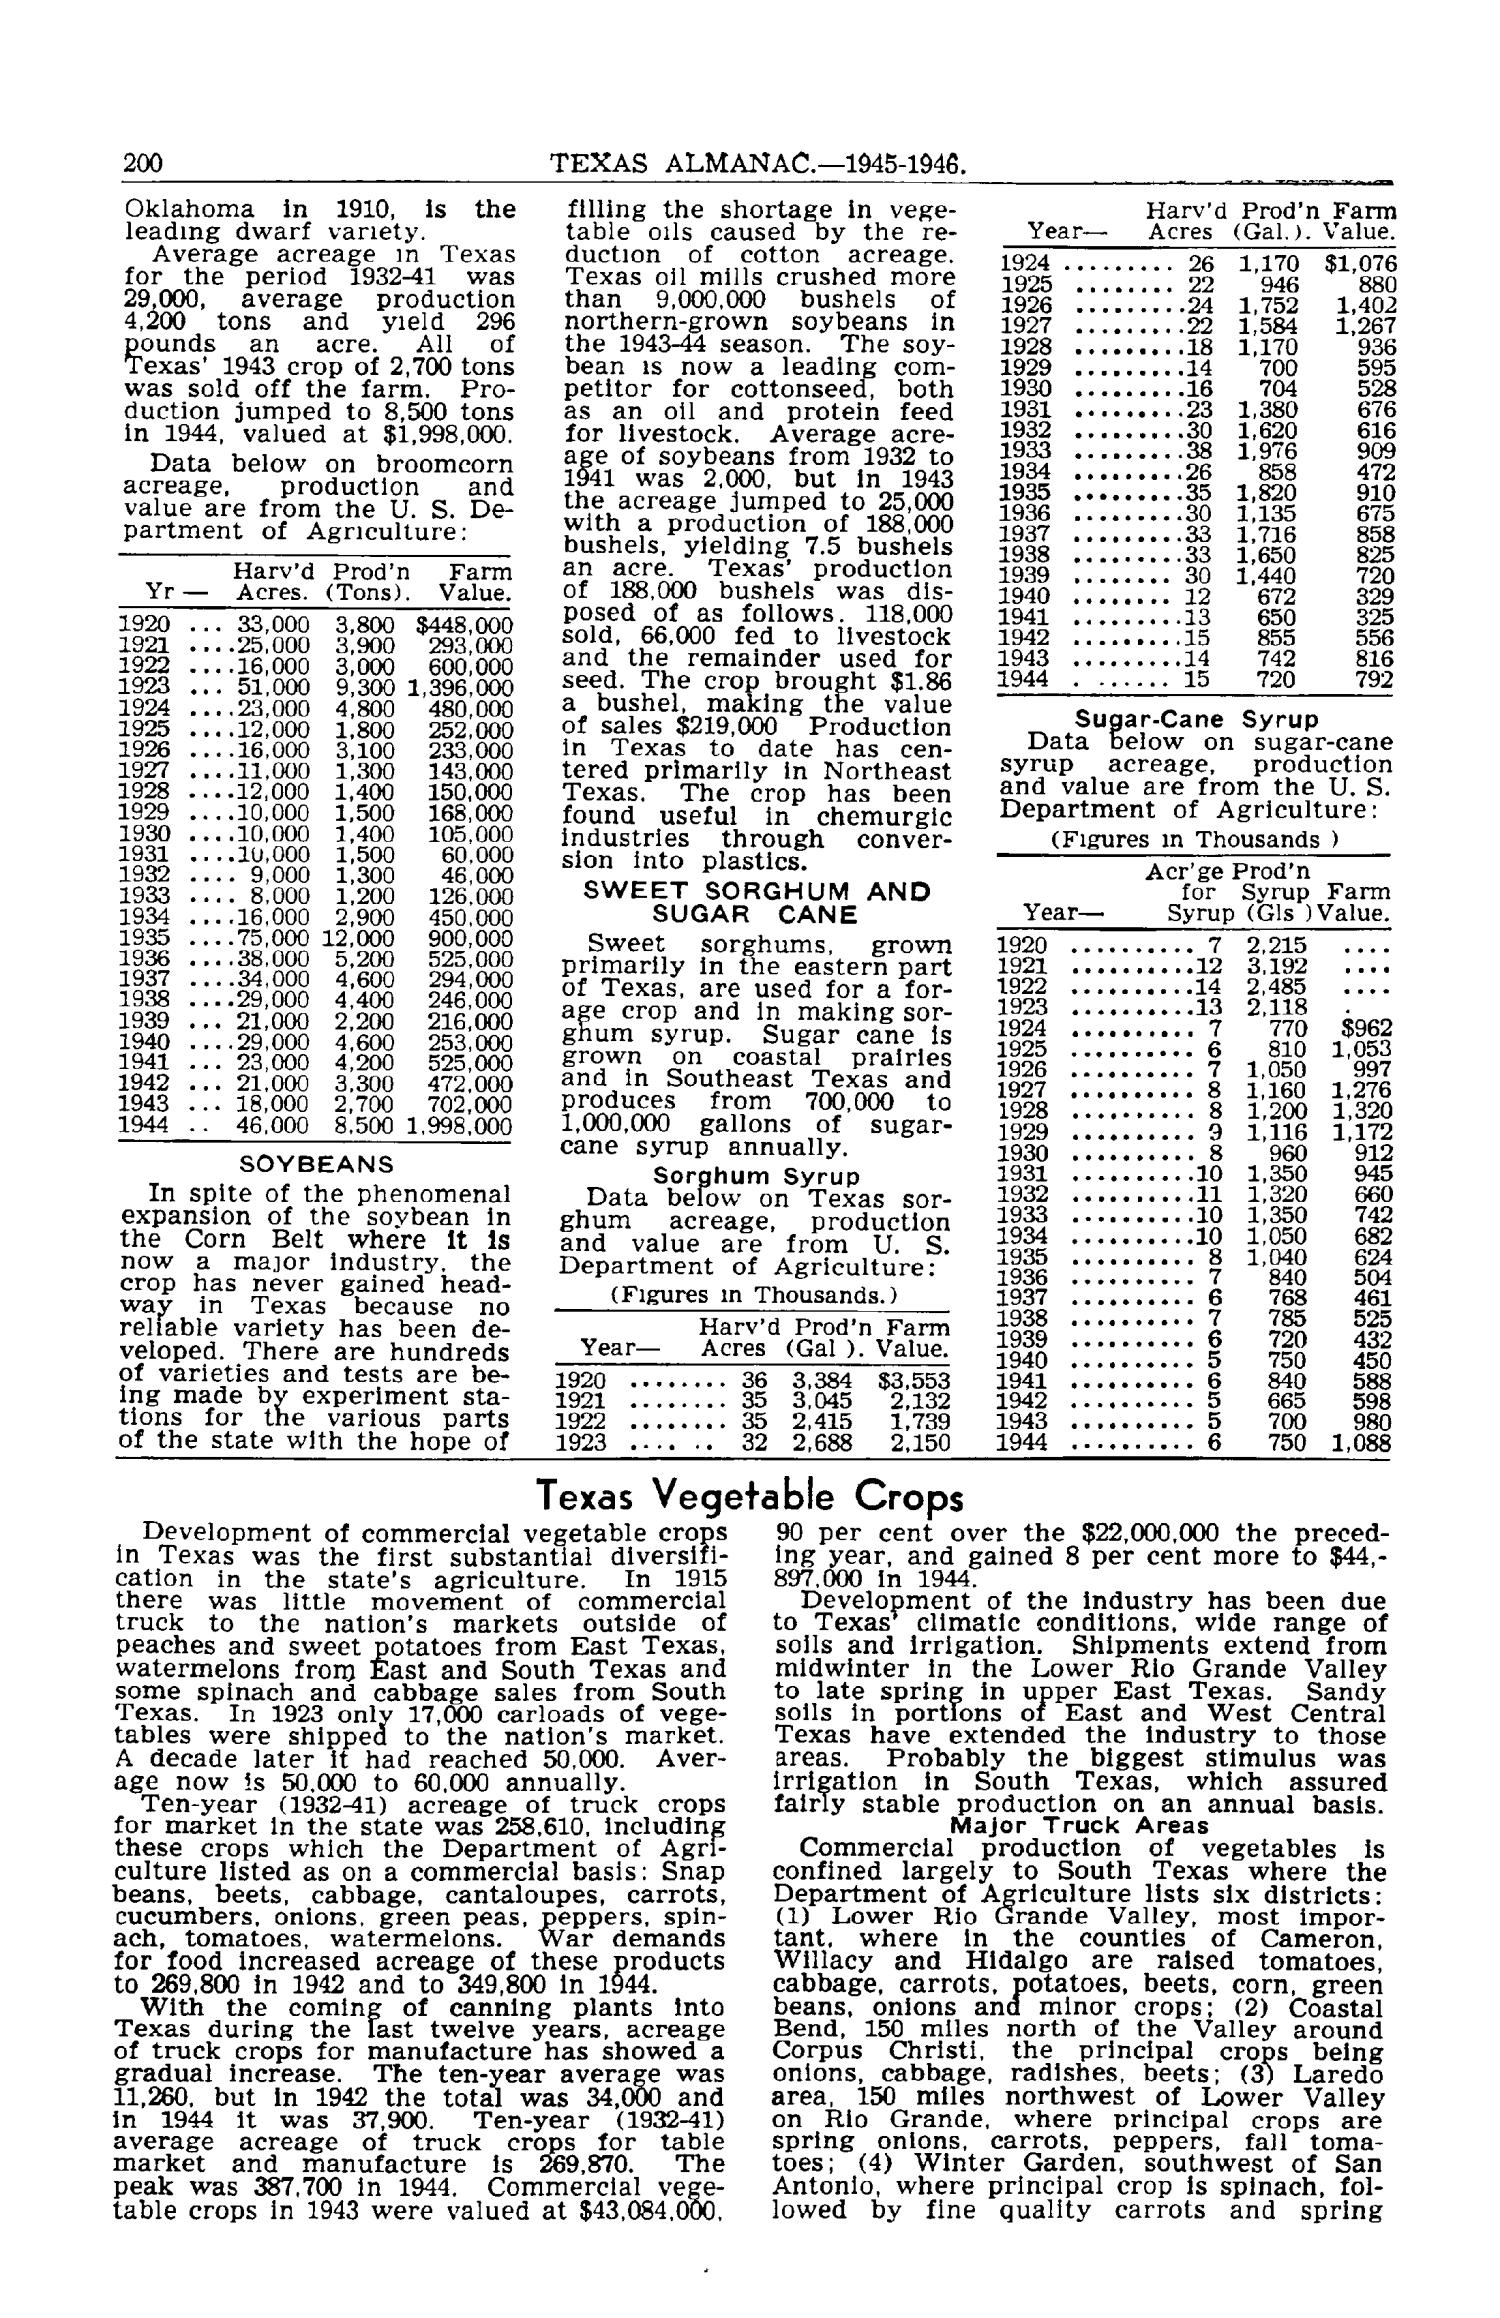
Sorghum Syrup
Data below on Texas sor-
ghum acreage, production
and value are from U. S.
Department of Agriculture:
(Figures in Thousands.)
Harv'd Prod'n Farm
Year- Acres (Gal ). Value.
1920 ........ 36 3,384 $3,553
1921 ........ 35 3,045 2,132
1922 ........ 35 2,415 1,739
1923 ...... 32 2,688 2,150
Harv'd Prod'n Farm
Year- Acres (Gal.). Value.
1924 .........26 1,170 $1,076
1925 ........ 22 946 880
1926 ........24 1,752 1,402
1927 .........22 1,584 1,267
1928 .........18 1,170 936
1929 .........14 700 595
1930 .........16 704 528
1931 .........23 1,380 676
1932 .........30 1,620 616
1933 .........38 1,976 909
1934 .........26 858 472
1935 ........35 1,820 910
1936 ........30 1,135 675
1937 .........33 1,716 858
1938 .........33 1,650 825
1939 ........ 30 1,440 720
1940 ........ 12 672 329
1941 .........13 650 325
1942 .........15 855 556
1943 .........14 742 816
1944 ....... 15 720 792
Sugar-Cane Syrup
Data below on sugar-cane
syrup acreage, production
and value are from the U. S.
Department of Agriculture:
(Figures in Thousands )
Acr'ge Prod'n
for Syrup Farm
Year- Syrup (GIs )Value.
1920 ......... 7 2,215 ....
1921 .........12 3.192 ....
1922 .........14 2,485 ....
1923 .........13 2,118 9
1924 .......... 7 770 $962
1925 .......... 6 810 1,053
1926 .......... 7 1,050 997
1927 .......... 8 1,160 1,276
1928 .......... 8 1,200 1,320
1929 .......... 9 1,116 1,172
1930 .......... 8 960 912
1931 ..........10 1,350 945
1932 ..........11 1,320 660
1933 ..........10 1,350 742
1934 .........10 1,050 682
1935 .......... 8 1,040 624
1936 .......... 7 840 504
1937 .......... 6 768 461
1938 .......... 7 785 525
1939 .......... 6 720 432
1940 .......... 5 750 450
1941 .......... 6 840 588
1942 .......... 5 665 598
1943 .......... 5 700 980
1944 .......... 6 750 1,088
Texas Vegetable Crops
Development of commercial vegetable crops 90 per cent over the $22,000,000 the preced-
in Texas was the first substantial diversifi- ing year, and gained 8 per cent more to $44,-
cation in the state's agriculture. In 1915 897.000 in 1944.
there was little movement of commercial Development of the industry has been due
truck to the nation's markets outside of to Texas climatic conditions, wide range of
peaches and sweet potatoes from East Texas, soils and irrigation. Shipments extend from
watermelons from East and South Texas and midwinter in the Lower Rio Grande Valley
some spinach and cabbage sales from South to late spring in upper East Texas. Sandy
Texas. In 1923 only 17,000 carloads of vege- soils in portions of East and West Central
tables were shipped to the nation's market. Texas have extended the industry to those
A decade later it had reached 50,000. Aver- areas. Probably the biggest stimulus was
age now is 50,000 to 60,000 annually. irrigation in South Texas, which assured
Ten-year (1932-41) acreage of truck crops fairly stable production on an annual basis.
for market in the state was 258.610, Including Major Truck Areas
these crops which the Department of Agri- Commercial production of vegetables is
culture listed as on a commercial basis: Snap confined largely to South Texas where the
beans, beets, cabbage, cantaloupes, carrots, Department of Agriculture lists six districts:
cucumbers, onions, green peas, peppers, spin- (1) Lower Rio Grande Valley, most impor-
ach, tomatoes, watermelons. War demands tant, where in the counties of Cameron,
for food increased acreage of these products Willacy and Hidalgo are raised tomatoes,
to 269,800 in 1942 and to 349,800 in 1944. cabbage, carrots, potatoes, beets, corn, green
With the coming of canning plants into beans, onions and minor crops; (2) Coastal
Texas during the last twelve years, acreage Bend, 150 miles north of the Valley around
of truck crops for manufacture has showed a Corpus Christi, the principal crops being
gradual increase. The ten-year average was onions, cabbage, radishes, beets; (3) Laredo
11,260. but in 1942 the total was 34,000 and area, 150 miles northwest of Lower Valley
in 1944 it was 37,900. Ten-year (1932-41) on Rio Grande, where principal crops are
average acreage of truck crops for table spring onions, carrots, peppers, fall toma-
market and manufacture is 269,870. The toes; (4) Winter Garden, southwest of San
peak was 387,700 in 1944. Commercial vege- Antonio, where principal crop is spinach, fol-
table crops in 1943 were valued at $43,084,000. lowed by fine quality carrots and spring
Upcoming Pages
Here’s what’s next.
 203 of 613
204 of 613
205 of 613
206 of 613
203 of 613
204 of 613
205 of 613
206 of 613
Search Inside
This book can be searched. Note: Results may vary based on the legibility of text within the document.
Tools / Downloads
Get a copy of this page or view the extracted text.
Citing and Sharing
Basic information for referencing this web page. We also provide extended guidance on usage rights, references, copying or embedding.
Reference the current page of this Book.
Texas Almanac, 1945-1946, book, 1945; Dallas, Texas. (https://texashistory.unt.edu/ark:/67531/metapth117166/m1/202/: accessed May 18, 2024), University of North Texas Libraries, The Portal to Texas History, https://texashistory.unt.edu; crediting Texas State Historical Association.